The Data Viz Design Process - Part 1
Jul 20, 2022
In this series of articles, I'm going to share my data viz design process. A step-by-step framework for creating graphs and charts. Part 1 is going to explain design, design thinking, and the benefits of using a design process. In the following parts, I'll explain each step in detail.
What is design and what is a design process?
Design is a plan to create something that will be beneficial to people. Design involves considering both the form and the function of the final product. When design is done well, the user does not even notice it. Good design makes products easier to use, and design applied to data visualization makes graphs and charts easier to understand.
Design involves thinking a lot about the user throughout the process of creating something. You may have heard of the term “design thinking”. This is a framework used in design to solve complex problems in a user-centric way. The design thinking process ensures great experiences and outcomes for the user.
The six phases of design thinking, according to the Nielsen Norman Group, are empathize, define, ideate, prototype, test, and implement. Empathize and define help us understand the problem. Ideate and prototype help us explore solutions. Test and implement help us materialize the final product.
When a product is created within the design thinking process, the user is considered in every step, resulting in a product that is thoughtfully designed to meet their needs.
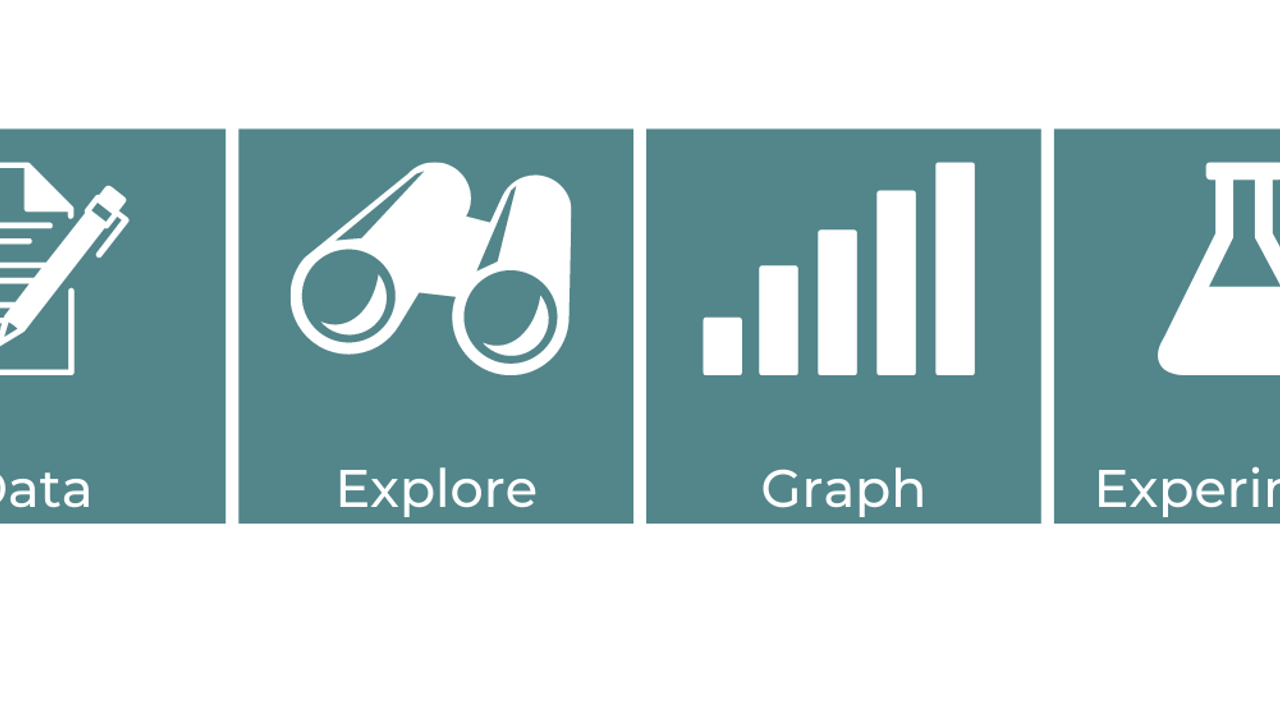
Design thinking is an example of a design process, and it's the framework I've adapted into my data viz design process.
Why use a design process?
A design process offers value to people working in the field of data visualization by focusing on the user to find out what they want and need to enhance their data-informed decision making.
Design processes are beneficial because they are user-centered. They start with understanding the user and their needs and end with testing solutions with the user to get feedback. A design process also encourages innovation and collaboration.
Not only that, but a design process also provides a step by step framework for completing a project, like creating a graph or chart. This framework helps streamline the work because you follow the same steps each time, making it easier to complete tasks.
A design process also saves time because you don't have to figure out each step for every project, you follow the same steps each time, and it allows you to think more about the design itself, the message, and how to best communicate your message because you're not thinking about what to do next, you just follow the process.
Design processes focus attention on the user, so they also result in better final products, in our case, better data visualizations, because the final audience is considered at each stage of the process.
In Part 2 of this series, I explain the first two steps of the Data Viz Design Process.
I'm currently launching my new online course - Data Viz Design Essentials. This course will teach you everything you need to know to create engaging graphs that clearly communicate your data, and the first launch has special introductory pricing.
Stay connected with news and updates!
Join our mailing list to receive the latest news and updates from our team.
Don't worry, your information will not be shared.
We hate SPAM. We will never sell your information, for any reason.
