What is R? What is RStudio?
Sep 15, 2022
Today I want to talk about one of my favorite things: R. Now what is R? R is a programming language, which means it's a language in which you type commands into the computer and then you run them and the computer does some stuff.
R specifically is a statistical programming language which means that it originally was created for doing statistical analyzes. It's primarily used for data analysis, machine learning, and data visualization, among other things. I use it primarily for those things, and I really really like R because it's free and it's open source. This means that it's free for you to use, and people add to it and make their own packages and libraries to make useful tools that then you can use too. For example, what I use to create plots is a package called ggplot2. It's an add-on to the base of R that I can download and use. And people have even added on to that package by creating things like ggradar which makes radar plots or ggext which puts text on plots in certain ways. So there's really so much out there! In terms of the people who are using R, there's a very large community. There are also a lot of these packages out there that add on to R and make it even more powerful and awesome to use!
Another reason that I like to use it is that it's got a really supportive community. There's a whole group of women using R who have formed a community called R-Ladies and you can find R-Ladies chapters in all kinds of major cities. There's also a lot online that you can find through things like Stack Overflow, tutorials, and Twitter. There are tons of users out there, which is really helpful when you're using a language because when you search things that you're struggling with and there's usually a solution you can find out there because someone else has asked the same kind of question.
I also just love to code and so if you like to code R is a great way to be able to do your data analysis and your visualization with code. Plus when you do it with code it means that it's what's called reproducible, which means that you can go back to it or you can share it with somebody else and they can use it and you can reproduce your own results. I have a visualization that I made an R on the books that I read in 2021 and I want to remake that with the books that I've read for 2022 and I can just use that same code to make the visualization again. I might make some tweaks and improvements, but I don't drag and drop things, I don't have to worry about how am I going to remake this when I have it in code. It's available for me to just run with new data and I can make it again. If somebody wants to check my work or use what I've done to advance, to take the next step then they can also use my code to reproduce it and go from there.
So R is a really awesome tool, and if you've never coded before it might seem kind of intimidating to use, but once you get the hang of it, you follow the same kinds of formulas and steps every time. You follow the same process, and once you get the hang of some of the basics it's really powerful! You start learning step by step, piece by piece from there.
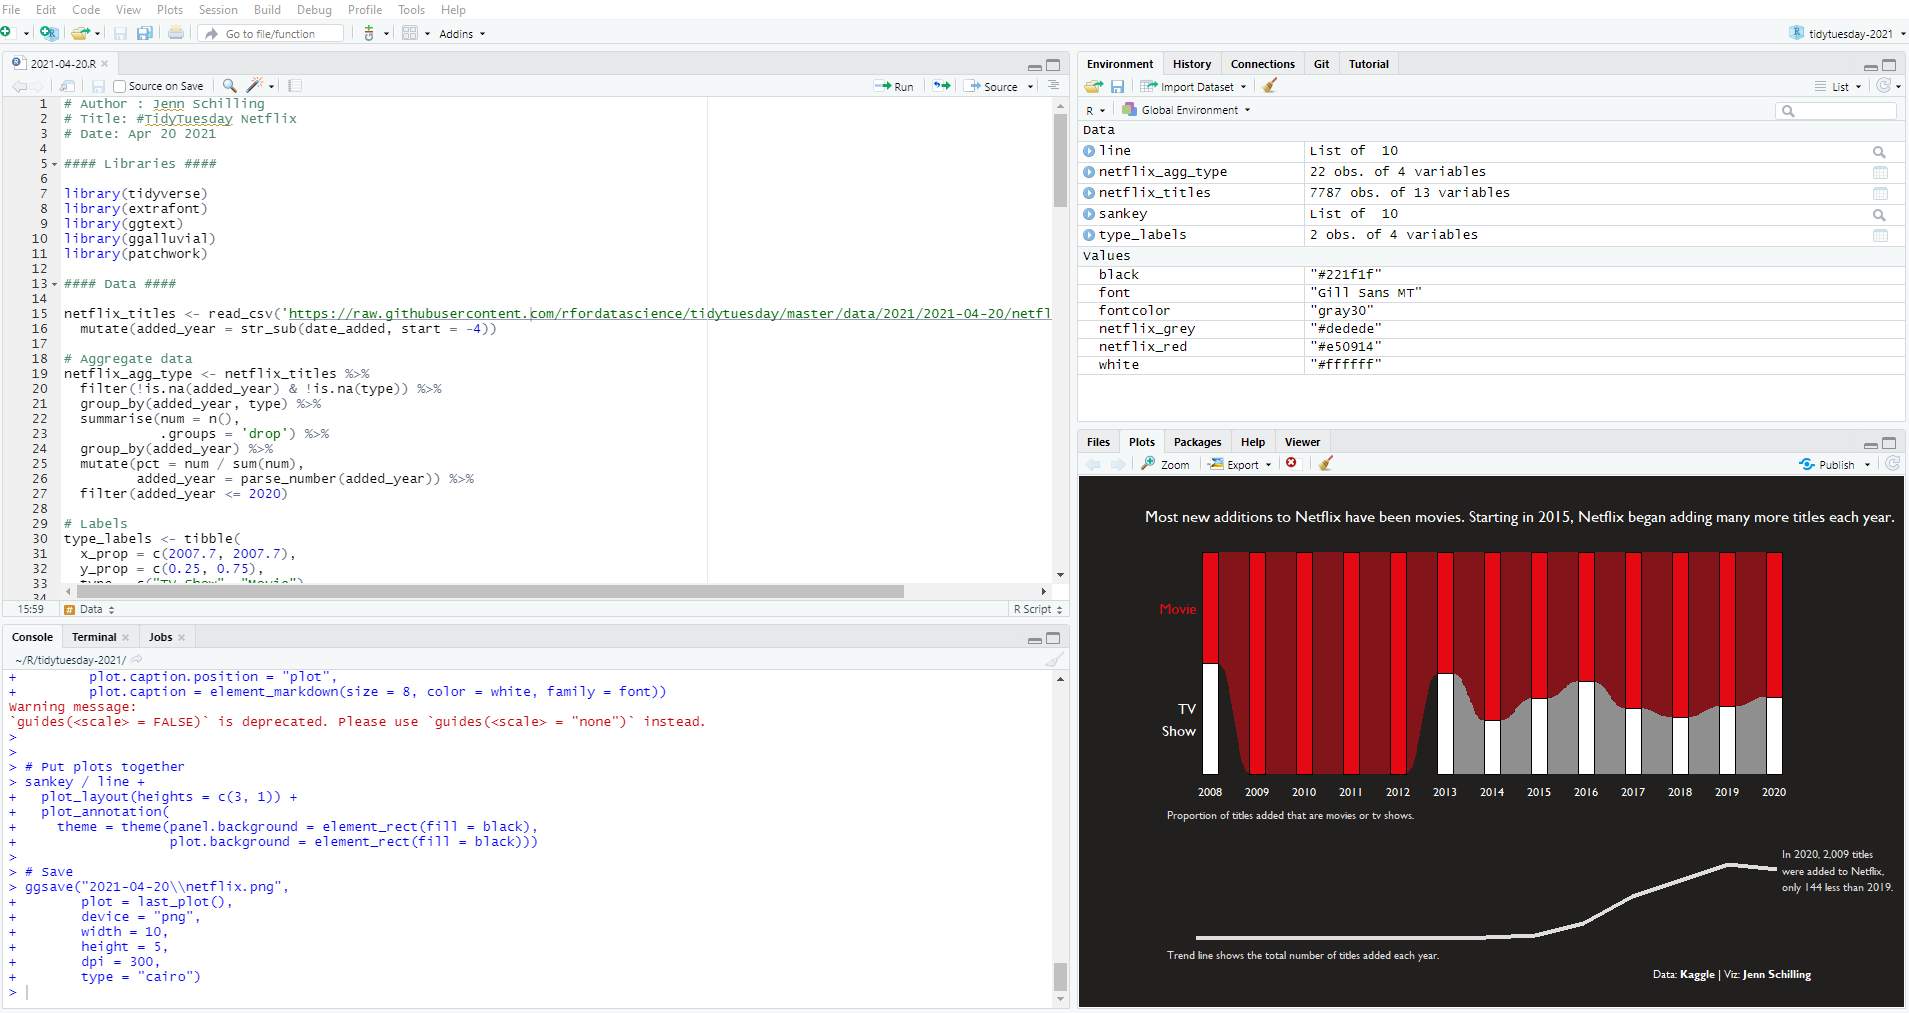
When I code in R, I use a development environment called RStudio. What that means is I have this program on my computer that I use to write my code in, and it's nice to have this because you can write your code in one place, you can see the output of it in another place, and you can also see what variables or data sets have been created in what’s called your environment, which is just your current session of R. So, RStudio is really helpful and nice for writing R code, and I'm going to take you on a little tour of it now.
When you first open RStudio the Console is going to be the whole left side of the application, and you won't have the Source window, but the Source window up in the top-left is where you write your R code. In this example, I have a .R file, which is an R script and that means that I can type all my code in here and save it for later. When you run code it appears in the Console, and you can type code directly into the Console as well. When you see the > symbol in the Console it means R is ready for code. The Environment is in the top-right of the application, and it shows the objects in your current R session such as data sets, functions, and variables. The bottom-right section of the application contains a few different things. One is a File directory so you can see what files are in the folder in which you’re working. There's also a view to show Plots, so if you’re creating a plot, it will show it to you there. This is super helpful because you can see the plot as you’re building it and make adjustments. Another part of this section is the Help tab, which allows you to look up the documentation for functions and packages to learn more about how to use them.

Now you know the four main panels in RStudio, and I've shared a little bit about why it's super useful to use. I also explained a little bit about what R is and why I like to use it. I'm planning to create more R based content, so if you like this let me know and be sure to subscribe to our newsletter to get the latest updates from Schilling Data Studio.
Stay connected with news and updates!
Join our mailing list to receive the latest news and updates from our team.
Don't worry, your information will not be shared.
We hate SPAM. We will never sell your information, for any reason.
