Rinse and repeat with your data
Apr 05, 2023
How often do you have to reproduce a data viz?
When you create an analysis or visualization in a software like Excel, Google Sheets, or Tableau, you have to click on all the options and write formulas inside cells or variables.
This can make it challenging for someone else to reproduce or replicate your results.
It can also make it challenging for you to easily repeat the process with different data.
How do you handle these challenges?
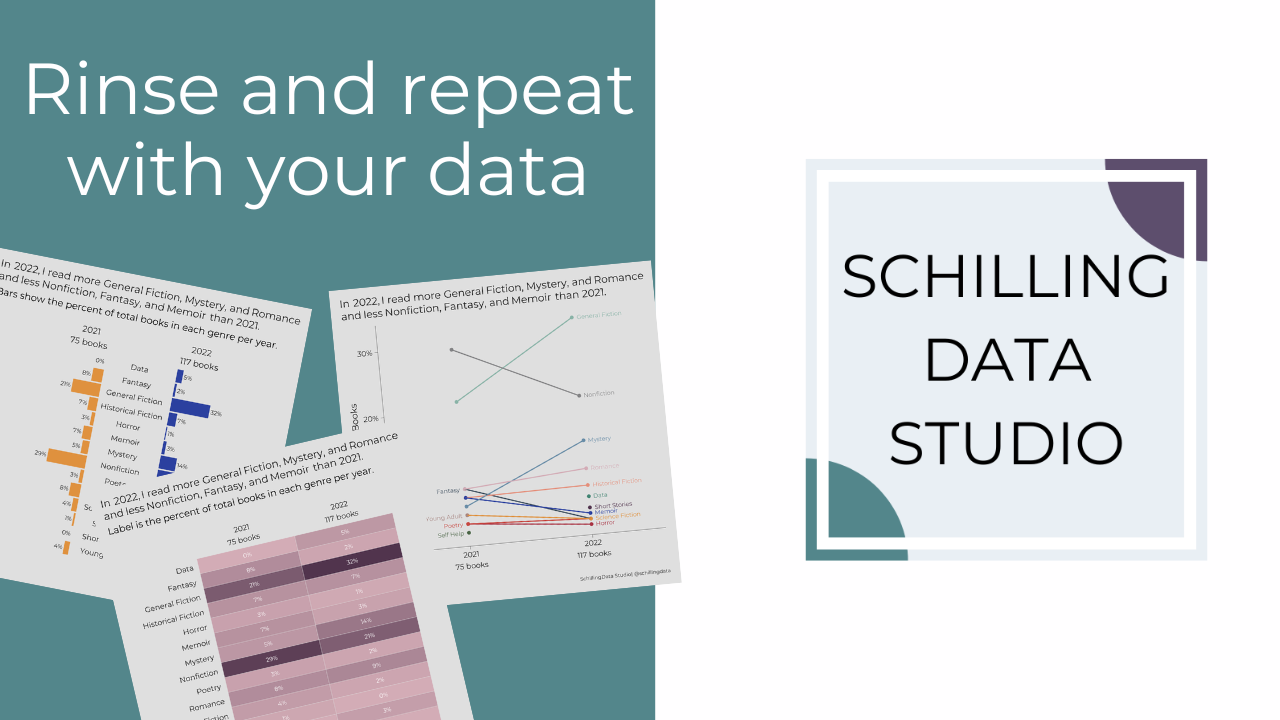
For me, when I use R, I don’t have these challenges, because the code to complete a data analysis or create a visualization can be shared with another person who simply has to run the code to reproduce the results.
Plus, every step of the process is written out in the code, making it easy for someone else to check the steps and see exactly what I did.
AND, I can run the same code with updated or different data over again!
The process of analyzing and visualizing data in R is a sequence of steps that is similar each time you do it, so once you learn the sequence and the tweaks you can make based on the type of data you have, it’s easy to repeat analyses with different data.
So, my data viz tip today is to think about how you can reproducibility into your workflow, whether that's by learning a tool like R or creating a process in your current tool to make it easier to reproduce your work.
Speaking of learning R, have you checked out Intro to R for Data Viz?
Inside, we're covering everything from installing R and RStudio to customizing graphs to importing and processing data for your own analysis.
I started Schilling Data Studio to make both data and a career in data more accessible and attainable for people.
R is a powerful tool for processing, analyzing, and visualizing data, and I want more people to know how to use it.
Inside Intro to R for Data Viz, you get hands on support through weekly office hours with me.
Plus, you get access to comprehensive training videos and resources as well as code examples.
My background in teaching gives me a unique and important perspective on how to guide people in learning and developing new skills.
You'll develop processes and workflows that will allow you to automate, repeat, and reproduce your data work in R.
These processes will save you time, allow you to share your work, and help you create more advanced visualizations and analyses.
What are you waiting for, join today!
This post originally appeared in my newsletter, the Studio Scoop. Want more stories and data viz tips like this? Subscribe below.
Stay connected with news and updates!
Join our mailing list to receive the latest news and updates from our team.
Don't worry, your information will not be shared.
We hate SPAM. We will never sell your information, for any reason.
